🕑| 16-minute read
“Cities have no option but to strive to be competitive in a new marketplace forged by globalisation and new technology.”
Martin & Simmie¹
1. Competitiveness in the epoch of cities
Urban environments that foster innovation, attract talent and leverage networks will compete strongest and benefit most from the rapid economic shifts around us.
From Adam Smith to Michael Porter², the concept of competitiveness has largely been reserved for national economies. But focusing solely on nations, when trying to improve the economic lives of working people, has become inadequate.³

Today, 54 per cent of the world’s population lives in urban areas, a proportion that will increase to 66 per cent by 2050.⁴ Cities are critical centres of economic opportunity and dynamism. The 300 largest metropolitan economies in the world now account for nearly half of all global output.⁵ New Zealand started urbanising in the 20th century and since then, some 99 per cent of all population growth has occurred in urban areas (Figure 1). Like much of the world, New Zealanders are heavily invested in their cities.
The global growth of cities coincides with increasing returns to knowledge, entrepreneurship and the creative class.⁶ The result is fresh and fierce competition for labour among cities. This competition is important because the success of cities can wax and wane, seemingly independent of
the performance of the national economy.
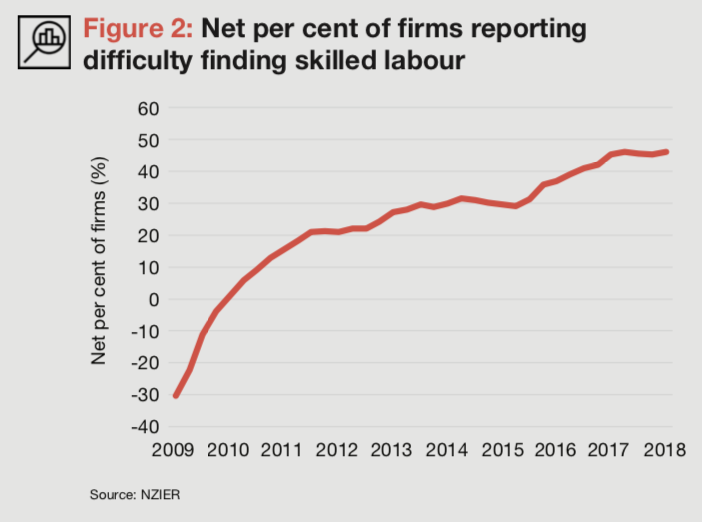
The demise of the rust belt (with a reliance on steel production and heavy industry) occurred as America began a period of sustained growth.⁷ Closer to home, Dunedin, once New Zealand’s largest city, has barely added as many people in the last 90 years than Auckland did in 2018.⁸ Clearly, the global elevation of cities does not mean all cities will succeed.⁹ In this context, New Zealand’s chronic shortage of talent is worrying. Today’s skills shortage is among the worst recorded in 40 years and has been steadily climbing since the financial crisis (Figure 2). To ease the shortage, we need to compete. And on this front, cities must lead.
The concept of urban competitiveness is not a straightforward one. Places do not compete in the same way as a commercial enterprises. There is no single objective. No bottom line. Instead, urban competitiveness is multifaceted and complex. It can include mobile investment, population, tourism, public funds and events. There is competition for modern and efficient infrastructure, local democracy and governance, as well as flexible land and property markets,¹⁰ environmental standards and quality of life.¹¹ Some dimensions of competitiveness change from year to year (cost of living),
some across generations (networks and sectors), while others are largely fixed (weather and distance to market).
This study focuses on short-run changes in economic competitiveness, using a concept of ‘discretionary income’.¹² Income and cost of living is dynamic, varying considerably between cities and across time. Taking a comparative approach we study changes to the balance sheet of a prospective resident, uncovering the shifting state of competitiveness for labour over the last decade. We show which ones are gaining and which are falling behind. In the face of persistent and chronic skills shortages across many New Zealand cities, these differences matter more than ever.
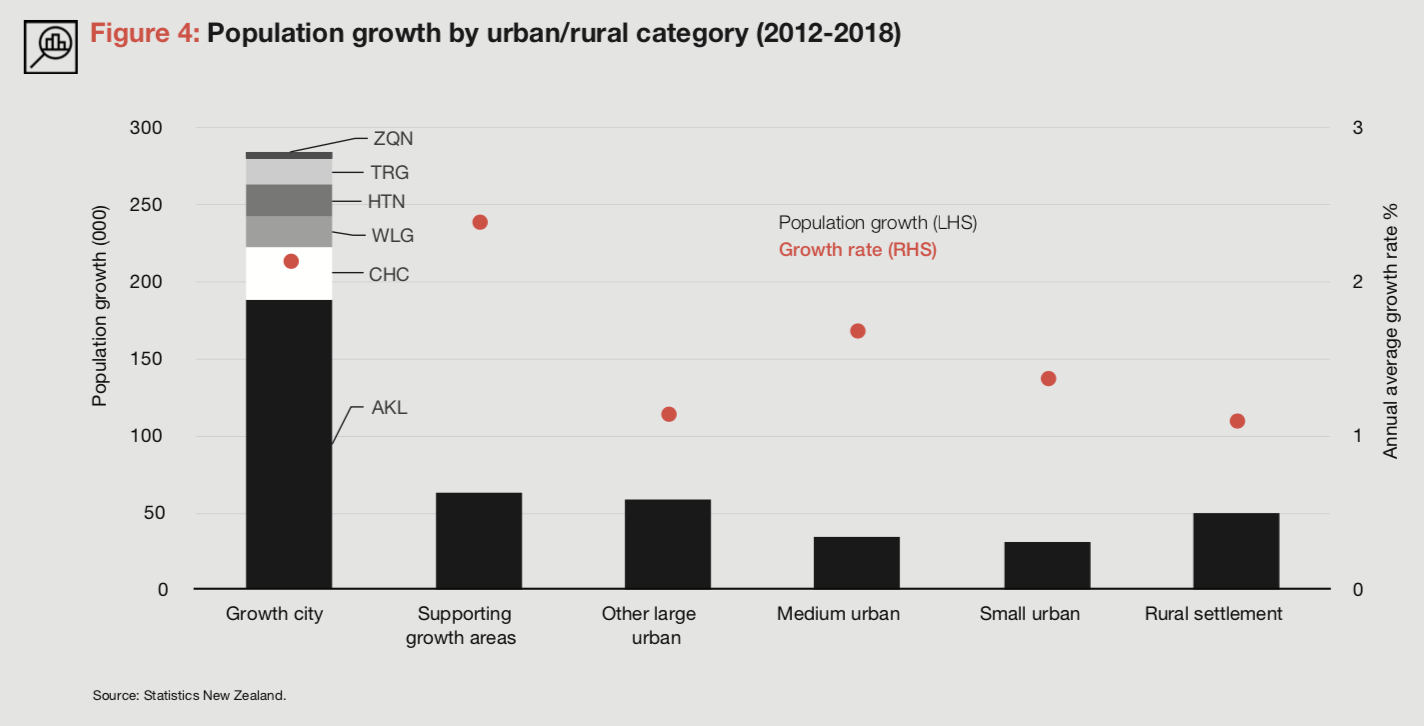
We focus on six key cities in New Zealand. These cities are Auckland, Tauranga, Hamilton, Wellington, Christchurch and Queenstown. Together, these cities (collectively designated Growth Cities) and their supporting growth areas accounted for 72 per cent of all growth in New Zealand between 2012 and 2018, adding some 346,000 people (Table 1).

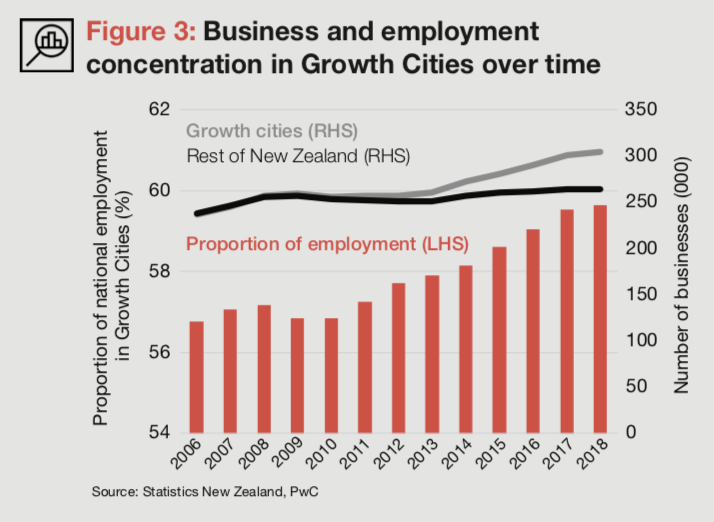
For every new business established in the rest of New Zealand over the last six years, five were established in Growth Cities. Likewise for employment, for every new job in the rest of New Zealand, three were created in Growth Cities. Population growth is linked to ever concentrating employment and business in these six cities. Until about 2010, the number of businesses was approximately equal between Growth Cities and the rest of New Zealand (see Figure 3). This changed in 2010 and the wedge is getting larger.
This report is separated into six sections. Section 2 describes the methodology. Section 3 describes changes in income and cost of living, while Section 4 charts the shifting economic landscape of New Zealand’s cities over the last decade. Section 5 extends the analysis to Australian cities and Section 6 concludes with recommendations to enhance New Zealand’s urban competitiveness. Individual city reports are available separately.
“The pace and scale of change in today’s globalised, digitised economy is leading to an unprecedented transformation of cities around the world.”
Jeremy Kelly, Director in Global Research at JLL¹³
2. Methodology
In this era of rapid technological change, we must direct our attention to the competitiveness of the urban economy, and to policies to enhance that competitiveness
While direct measurement of competitiveness is a challenge, one can “gauge its nature and magnitude by the shadow it casts.”¹⁴ To measure this ‘competitiveness shadow’, we consider urban life from the perspective of a new median resident looking in. We focus on the economic factors that give rise to short-run changes in the household balance sheet of a new prospect resident. Where are incomes growing fastest? How do housing costs stack up? What might your discretionary income look like in different cities?
A comparative approach is used to evaluate urban competitiveness in New Zealand and Australia. By emphasising changes in discretionary income within a city and how these changes stack up between cities, we overcome data limitations and complex spatial differences¹⁵ that might otherwise limit the analysis.
We use the period 2008 to 2018 because it closely resembles a full business cycle. The last decade includes a housing and migration cycle for many cities, meaning beginning to end comparisons go some way to account for normal business cycle changes (to the extent that these are synchronous across cities).
The analysis is conducted for six urban areas in New Zealand, which we term ‘Growth Cities’. Growth Cities include areas with a relatively small population base and very high annual growth rates (e.g. Queenstown) as well as areas with lower annual growth rates but a larger population base (e.g. Wellington). The six Growth Cities are Auckland, Hamilton, Tauranga, Wellington, Christchurch and Queenstown.
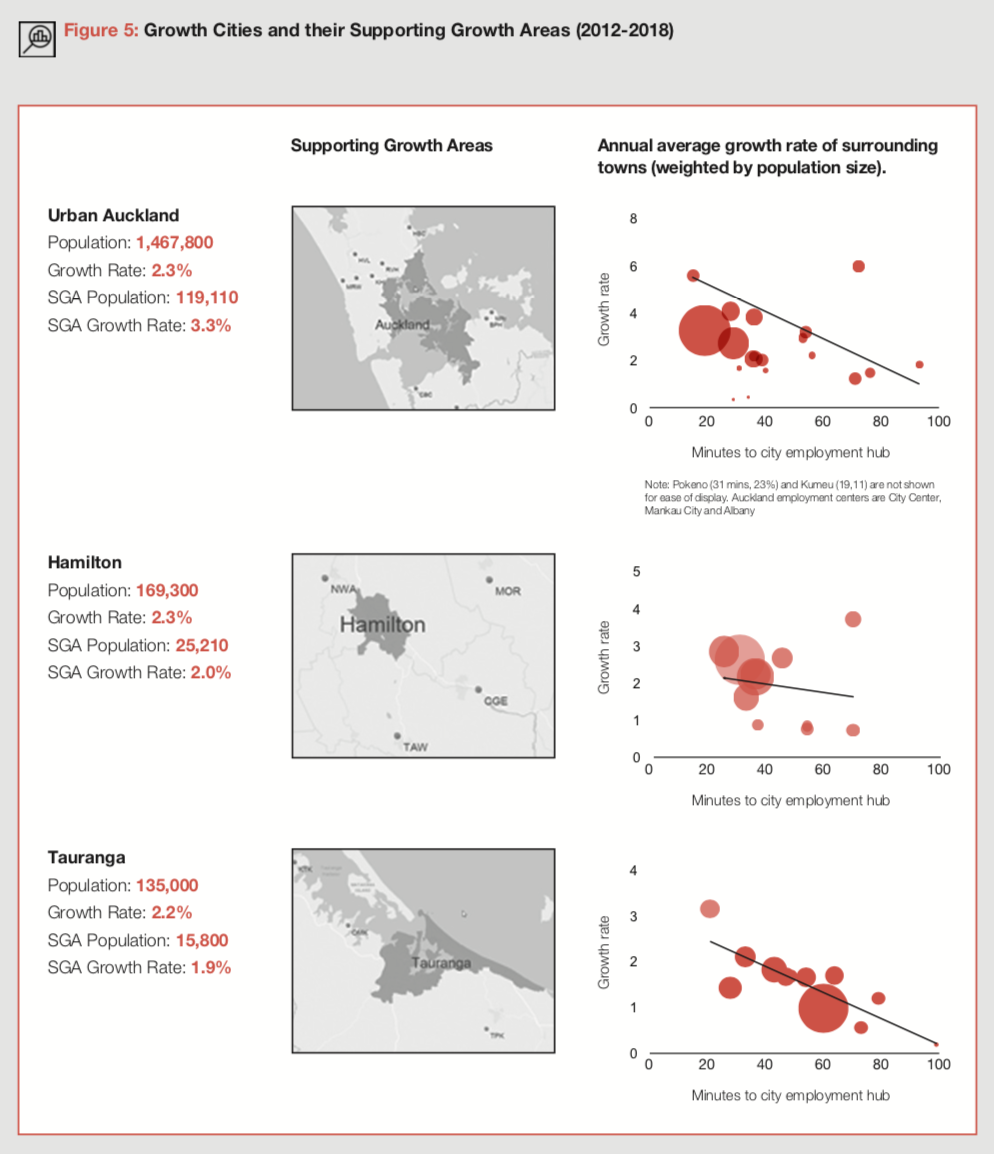
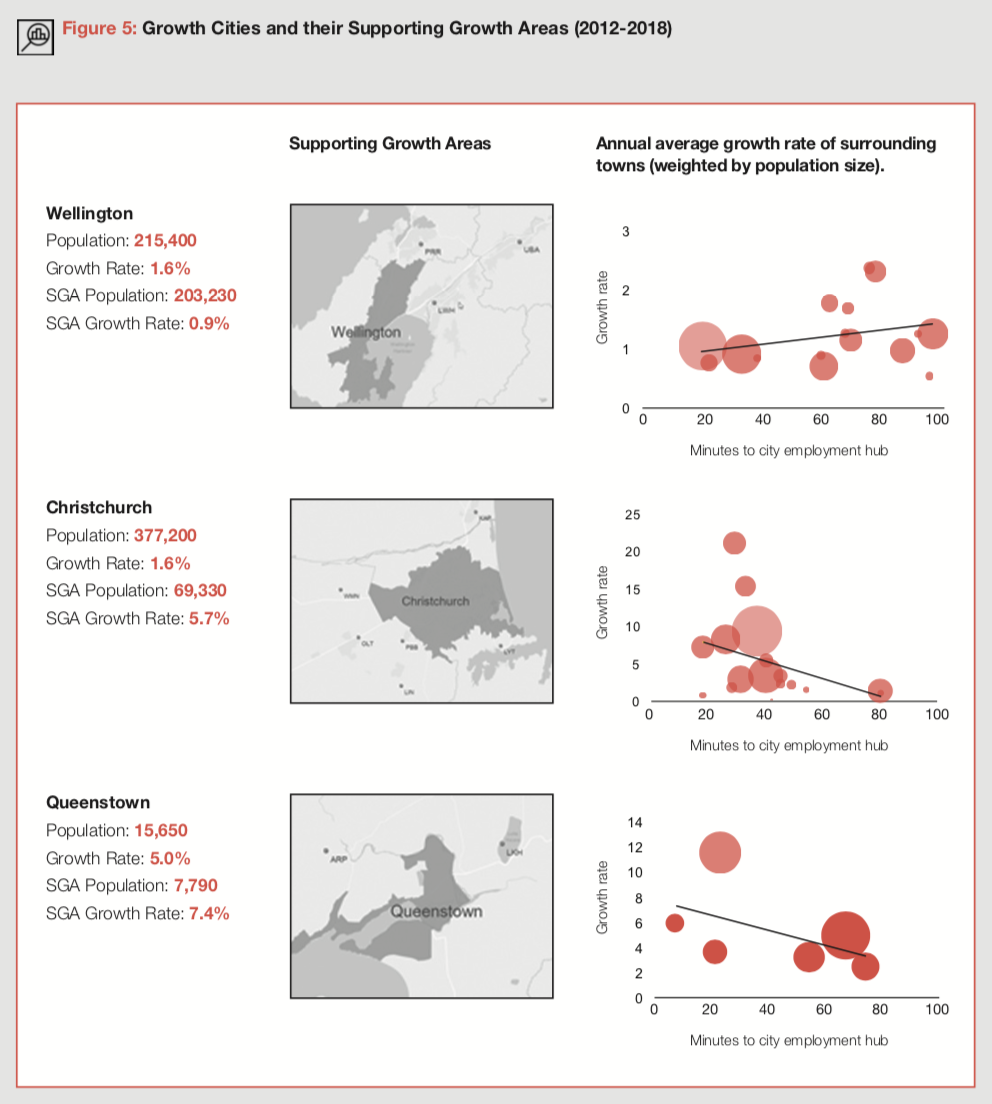
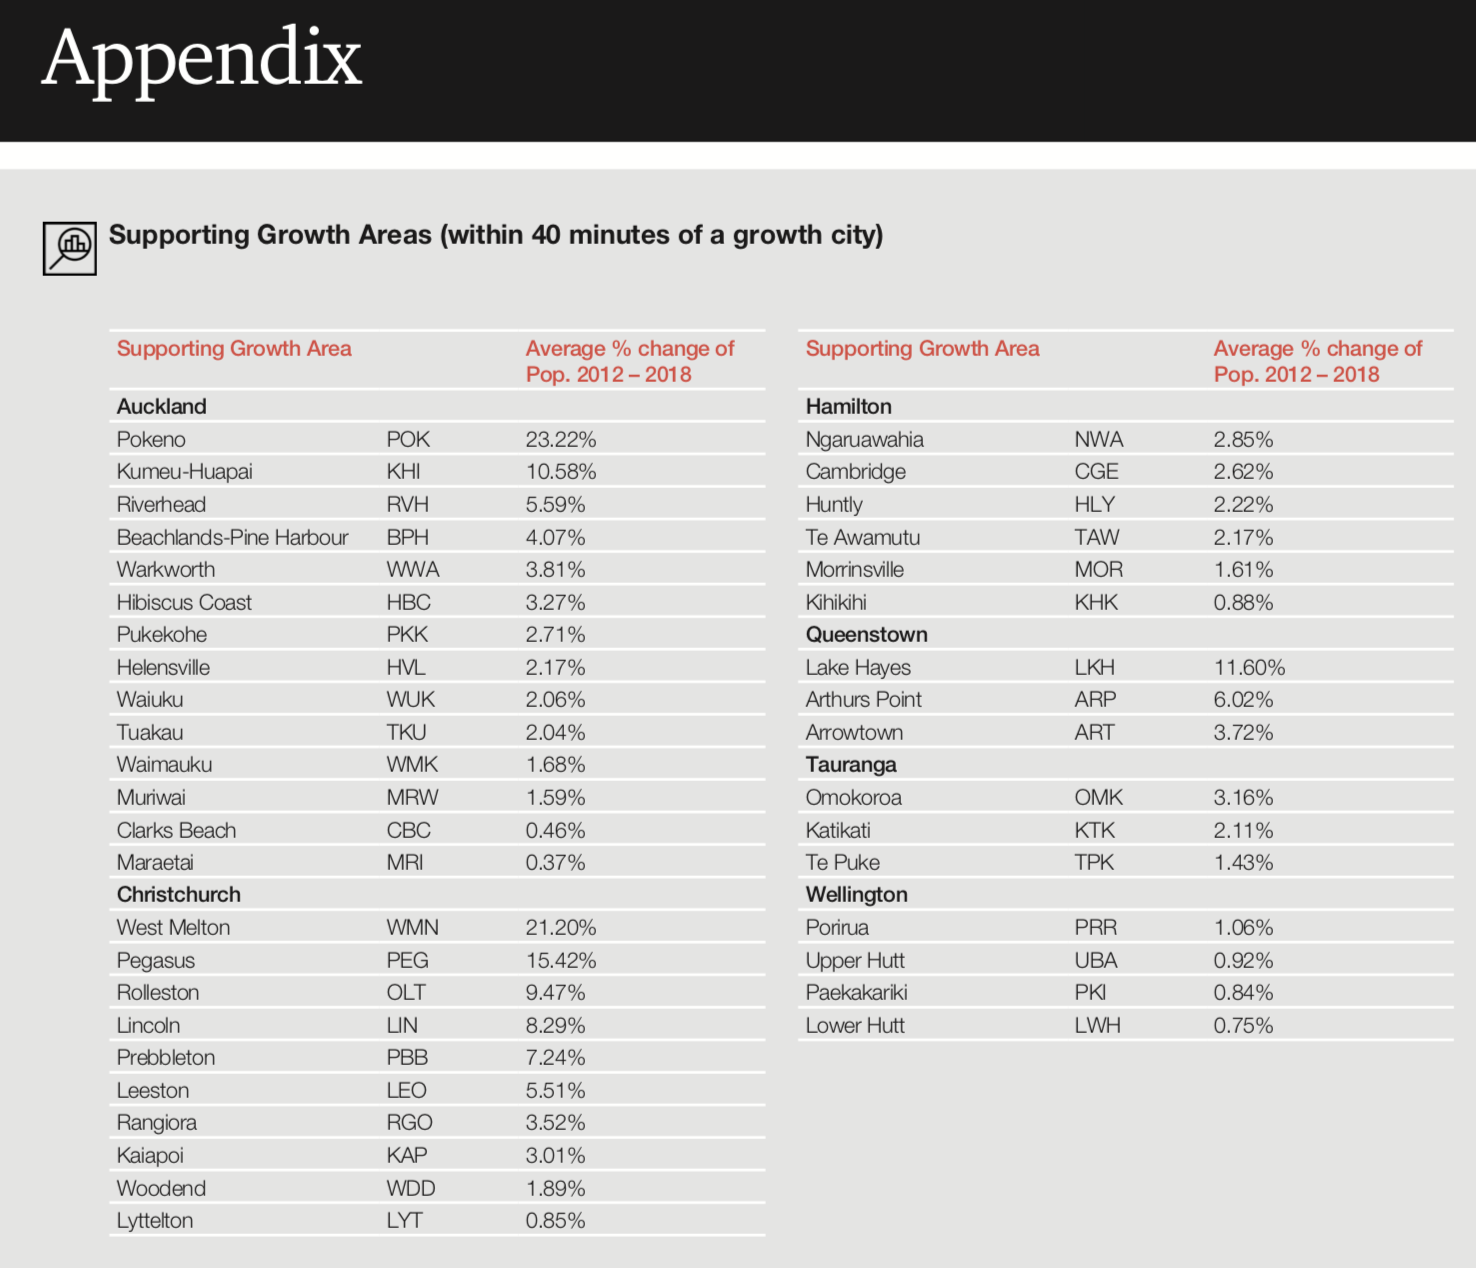
The Growth Cities are often surrounded by smaller but generally faster growing Supporting Growth Areas (SGAs).¹⁶ These areas usually have a population between 2,000 and 10,000 and have relatively higher annual growth rates. Located within a 40 minute commute of a major employment area¹⁷, SGAs arise from the economic dynamism of our Growth Cities as residents trade-off higher house prices for a longer commute. This is shown by a generally negative relationship between travel time to a city and the growth rate of surrounding towns (shown in Figure 5). While SGAs usually fall outside the area of analysis, we often refer to these areas in our interpretation, since labour markets do not adhere to the lines drawn around cities for statistical and democratic purposes. The full list of SGAs is presented in the Appendix.
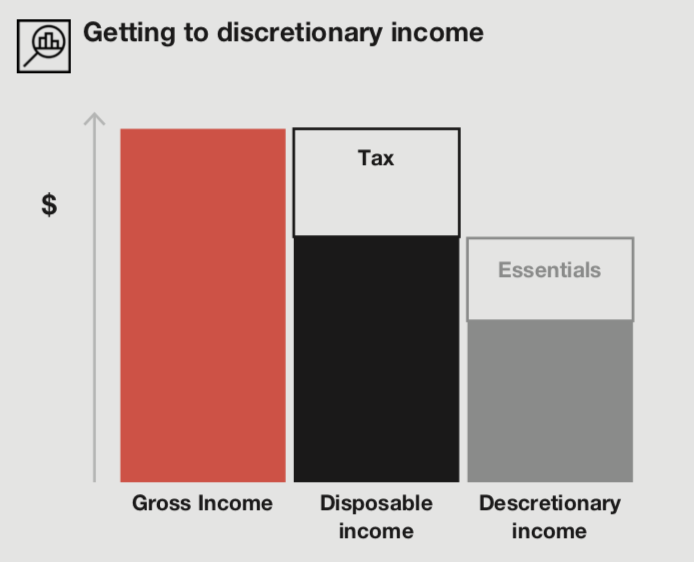
We begin by evaluating median household income across New Zealand’s Growth Cities. Income is defined as all earnings for a usually resident aged 15 years and over. It includes all sources of income, such as wages, self-employment, rent, dividends, interest and government payments. We use median income from the census and adjust it using income growth rates from Statistics New Zealand Linked Employer-Employee Data. Disposable income is calculated by deducting tax, where our base case assumes household income is split two thirds, one third between primary and secondary earners.
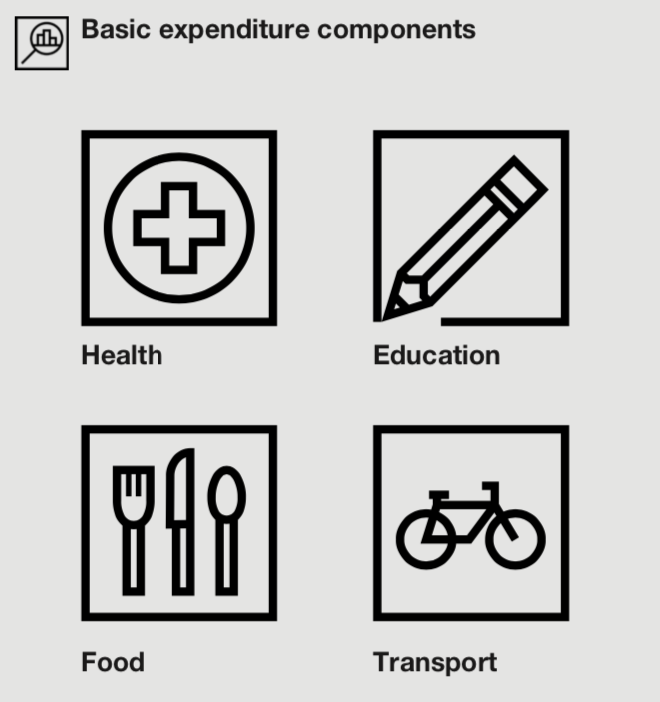
The cost of living falls into two buckets, basic expenditure and housing costs. Basic expenditure is taken from the Household Economic Survey (HES) and consists of four categories: food, transport, education and health. Limiting expenditure to these categories allows for comparisons with Australia. Basic expenditures come with caveats however, particularly for New Zealand cities. Survey data is available every three years (so that some extrapolation is necessary) and only for five regional areas: Auckland, Wellington, Canterbury, rest of North Island and rest of South Island¹⁸. The regional data is likely an under estimate for the city (except for Auckland where the Territorial Authority is the Region). The rest of North Island and rest of South Island are likely under estimates for Tauranga, Hamilton and Queenstown respectively. Basic expenditure for the Australian cities is at the city level and comes without these spatial issues.
Housing costs are considered separately, so that marginal housing costs are applied (for a new resident), as distinct from average housing expenditure, as captured in the HES (paid by residents already in a city). For simplicity, we narrow the analysis to home ownership. Rental costs will be the subject of future analysis. Mortgage payments for the median household are calculated using a three year mortgage rate (calculated for each year of the analysis) and principal equal to 80 per cent of the house price, using a 30 year repayment period. We assume the household is able to meet deposit requirements¹⁹. The marginal housing cost is calculated as a proportion of the median house price (usually a proportion of one, so that the median household is buying a median house). Since the analytical focus is on changes across time, this assumption matters relatively little to the final results. Under sensitivity testing, when a median household spends less on housing, expensive cities do a little better; if a median household spends more, cheaper cities do a little better.
We use a median household as the base unit for the analysis. The median is chosen for three reasons. First, it is less sensitive to large changes at the top of the distribution, particularly important for measures of income. Second, the median is a good measure of a representative resident in each city. While not a perfect guide for labour competitiveness of high income households, doctors and executives need teachers and firefighters. Third, data on the median is readily available across each of the dimensions required.
The primary analytical insight is a description of the change in discretionary income (income less tax less basic expenditure) for the marginal city household. The results are a window into the changing nature of urban competitiveness for labour across time and space.
3. Household income and expenditure
Income: The catch-up is on
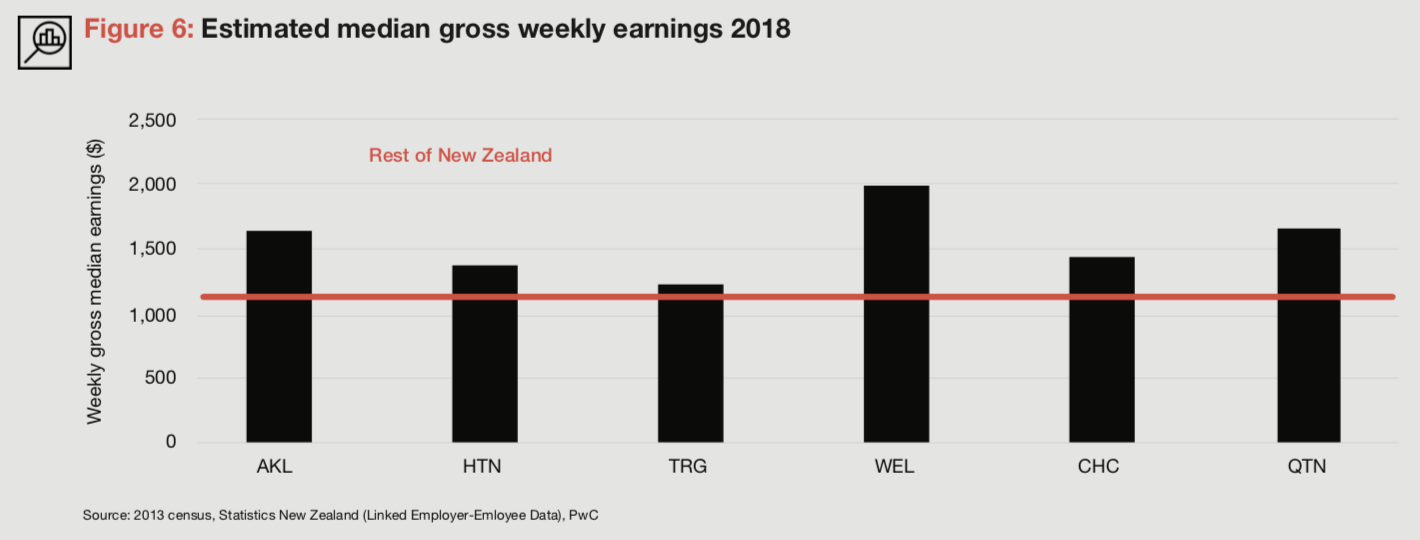
There are significant differences in the incomes of Growth Cities. Wellington has the highest median weekly household income of $1,997 (Figure 6), compared to $1,650 and $1,438 in Auckland and Christchurch respectively. Median earnings are generally much higher in the Growth Cities as a whole relative to the rest of New Zealand.
Income growth slowed after the Financial Crisis but has accelerated since (Figure 7). Since 2010 median household income growth was strongest in Christchurch and Tauranga. Queenstown experienced the strongest pre-crisis income growth, but a longer and more pronounced slump.
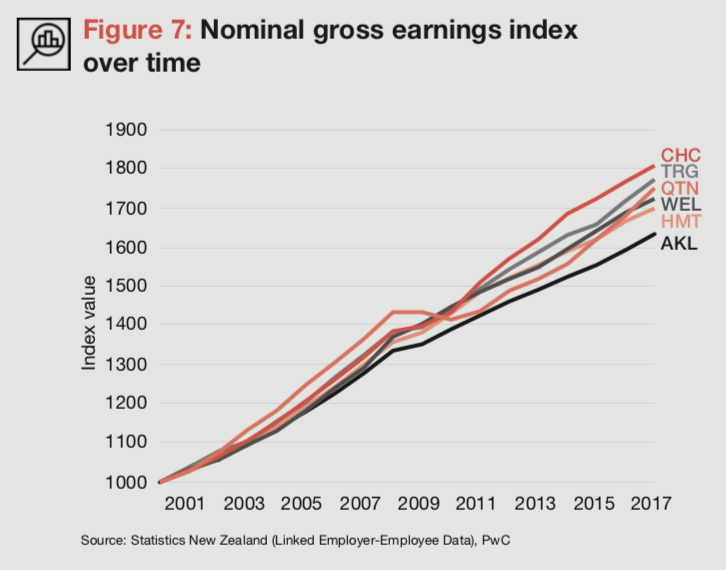
Auckland is losing its income advantage. Outside of Wellington, Auckland has traditionally had a wage premium over other urban areas. However, median household income growth has been sluggish in Auckland for many years (Figure 7). Auckland’s median household earnings have grown at the lowest rate of all Growth Cities since 2000, averaging just 0.8 per cent per year (in real terms), compared to 1.4 per cent in Christchurch.
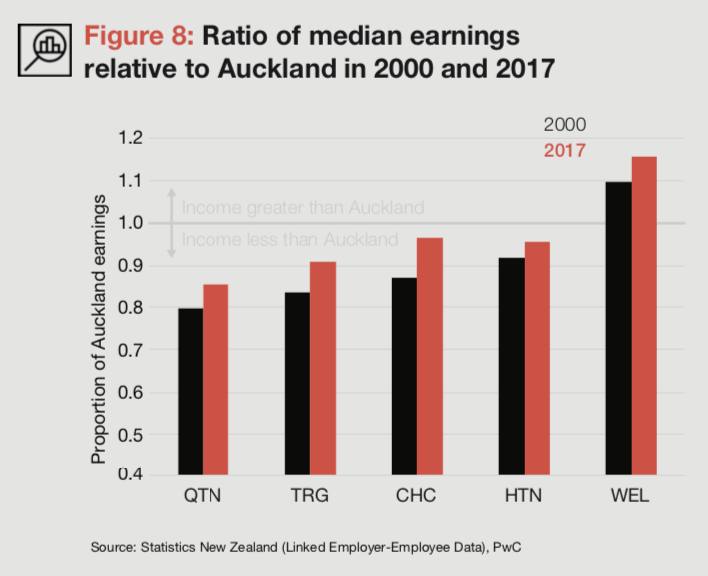
Consequently, other New Zealand cities are catching up. Median household income in Christchurch was 87 per cent of Auckland in 2000 (Figure 8). Today the two cities are almost equal. This might be explained by some combination of a smaller share of economic growth going to labour, falling relative productivity, or because of changing demographics and population, that shift the earnings distribution.
Basic expenditure and housing Basic expenditure has grown faster in regions with large cities (Figure 9). In 2008, health, education, food and transportation expenditure differences were relatively small. By 2018, large differences had emerged. Auckland’s real basic expenditure increased by $151 per week over the period, compared to $104 in Canterbury and $97 in Wellington (Figure 9). Basic expenditure could be increasing faster than general prices (a price effect), or because household consumption is increasing (a quantity effect).
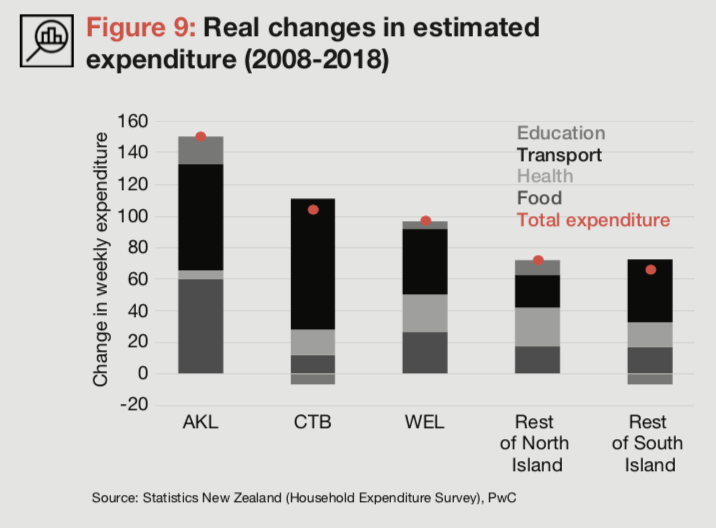
Transport and food have increased most in the large regions. Real expenditure on food increased by $60 per week in Auckland, compared to $26 in Wellington and $12 in Canterbury. Expenditure on fresh produce grew almost twice as fast in Auckland than New Zealand as a whole. Transport expenditure grew fastest in Christchurch, increasing by $83 per week.
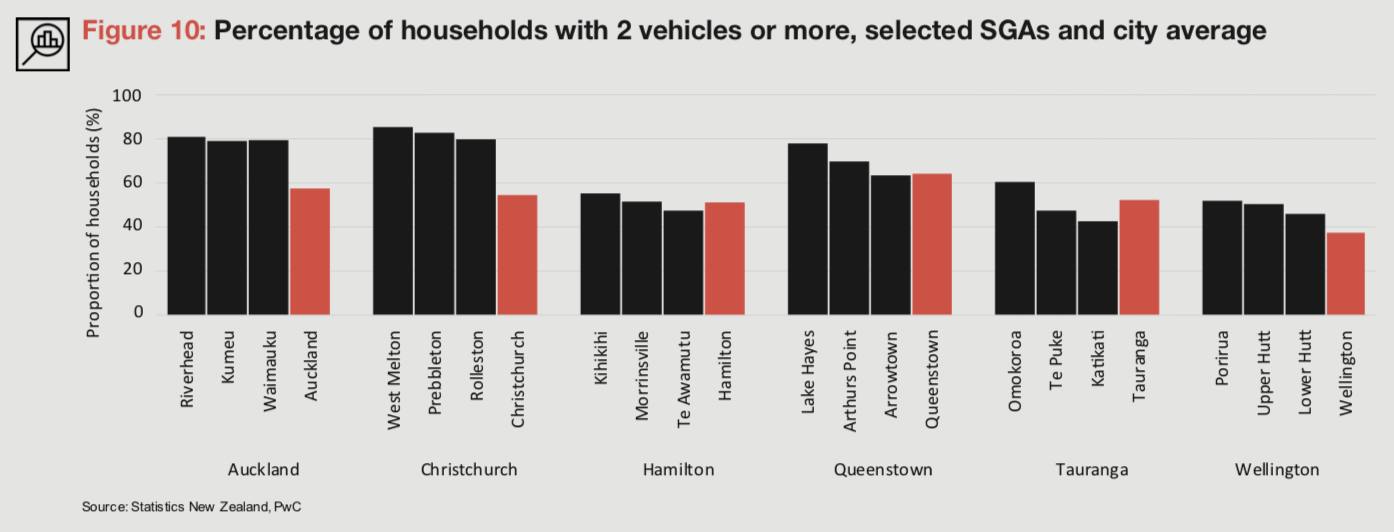
For instance, transport costs in Canterbury rose after the earthquakes and in tandem with faster and more sustained growth in the SGAs of Christchurch. In Auckland, higher transport costs also coincide with significant SGA growth, where car dependency is far greater than the city average (Figure 10).
4. Housing expenditure: contrasting fortunes.
Median house prices have increased dramatically over the last decade in New Zealand, but rates differ across Growth Cities (Figure 11).
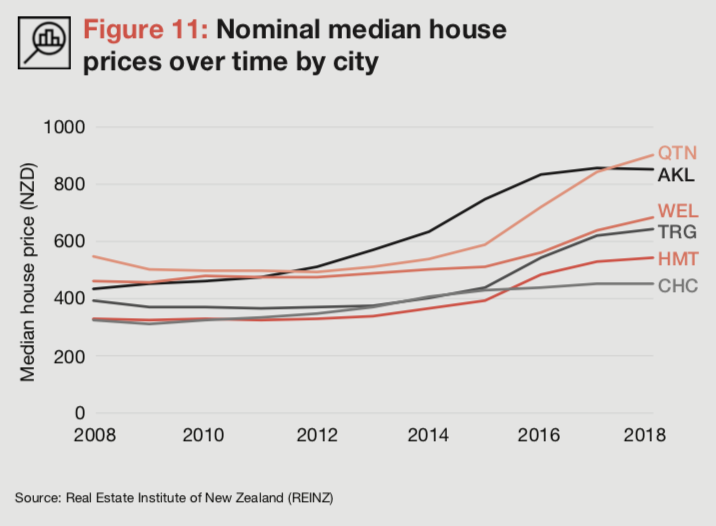
Auckland and Queenstown experienced the largest increases, with median prices rising by 96 per cent and 64 per cent respectively since 2008.
While the rise in house prices coincides with a period of low interest rates, differences in the magnitude and timing of price increases across cities suggest regional factors have played an important part.
Discretionary income
Wellington and Christchurch stand apart
Discretionary income, which may be saved or spent on consumables, is what remains from income after deducting tax, housing and basic expenditure. We use the discretionary income residual to illustrate changes in urban economic competitiveness of the Growth Cities as they relate to labour and the household.
There are secular trends common to all Growth Cities over the last decade. Discretionary income takes an inverse ‘U’ shape for all Growth Cities (Figure 12). For the first half of the period, income generally rose faster than expenditure, helped by flat house prices and falling interest rates. During the second half, growth in basic expenditure and house prices began to outstrip income. While interest rates continued to fall, they did so at a reduced rate.
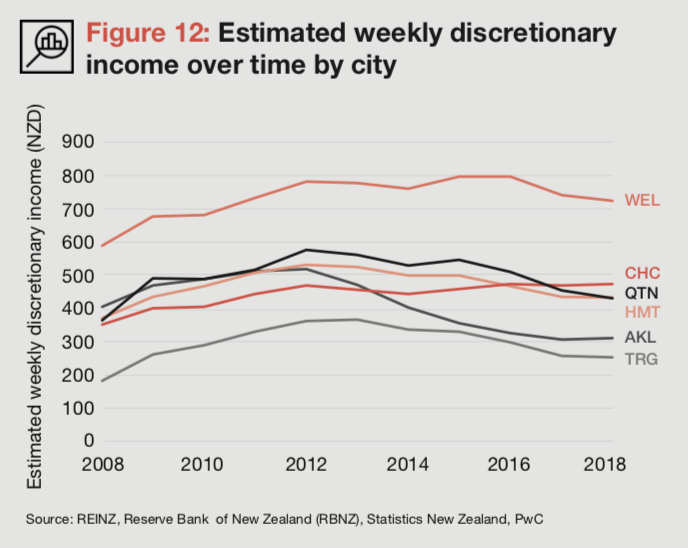
Substantial differences emerge between Growth Cities after 2012 (Figure 13). Auckland experienced the biggest and earliest falls, commensurate with significant house price growth, sluggish income growth and rising basic expenditure. Tauranga and Hamilton experienced falls starting later, as house prices began to rise from 2015.
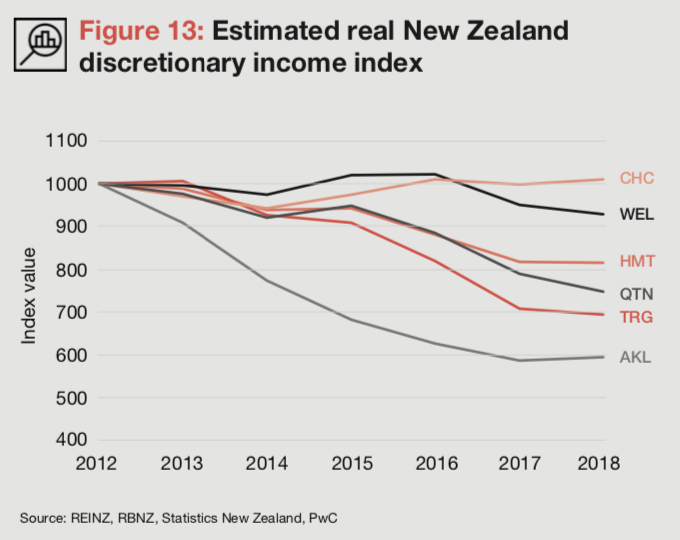
Wellington and Christchurch fared better. Wellington was buoyed by higher and relatively stronger income growth across the period, while changes to basic expenditure were relatively low. Christchurch is the only Growth City to have increased discretionary income since 2012, matching strong income growth with low housing costs.
Cities that do not implement policies to enhance their competitiveness risk a future of stagnation and marginalisation
UNHabitat²⁰
5. The case of Australia
Sydney and Melbourne face domestic competition
New Zealand’s cities compete with Australian cities for labour. In 2013, there were approximately 650,000 New Zealand citizens living in Australia, roughly 15 per cent of the population of New Zealand. With such fluid labour markets, the relative competitiveness of Australian and New Zealand cities is important. While cross-country comparisons are complicated by data inconsistencies (arising from methodological, spatial and definitional differences), overall trends in economic competitiveness are nevertheless valuable and provide important insight to our own urban challenges.
The economic competitiveness of five Australian cities is evaluated: Sydney, Melbourne, Brisbane, Perth and Adelaide. Median household income growth has been modest in Brisbane, Adelaide and Melbourne but stronger in Perth and Sydney.
House prices have eroded the competitive advantage of Sydney and Melbourne since 2012. Australia’s two global cities experienced some of the fastest house price growth in the world, rising by 113 per cent and 95 per cent respectively between 2008 and 2018 (Figure 14).
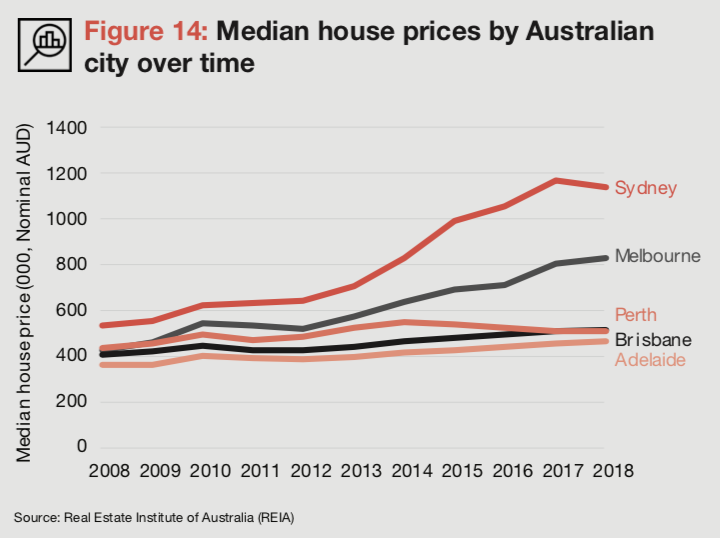
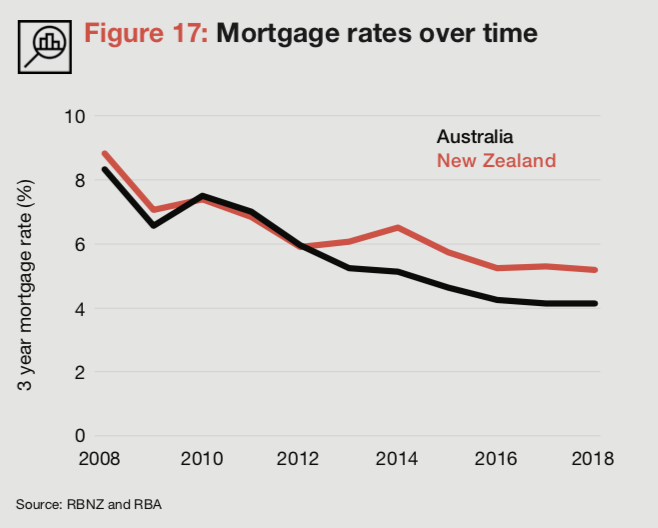
In stark contrast, Brisbane, Perth and Adelaide rose by just 27, 17 and 29 per cent respectively – well below all of New Zealand’s Growth Cities. Figure 15 shows the impact of this on mortgage payments (in real terms) in Brisbane, Perth, Adelaide and Auckland. Benchmarking against the median house price, a mortgage repayment for a new resident to Auckland (who meets deposit requirements) would face payments 15 per cent higher than in 2008. In contrast, a new resident to Perth would pay 40 per cent less, 34 per cent less in Brisbane and 33 per cent less in Adelaide. Part of this is attributable to lower interest rates in Australia compared to New Zealand (Figure 17) but house price differentials loom largest.
Basic expenditure changes are small. Melbourne and Perth both recorded minor increases in basic expenditure. Interestingly, Brisbane and Adelaide experienced falling real basic expenditure – a unique achievement among the cities. In contrast, Sydney experienced a large increase in basic expenditure.
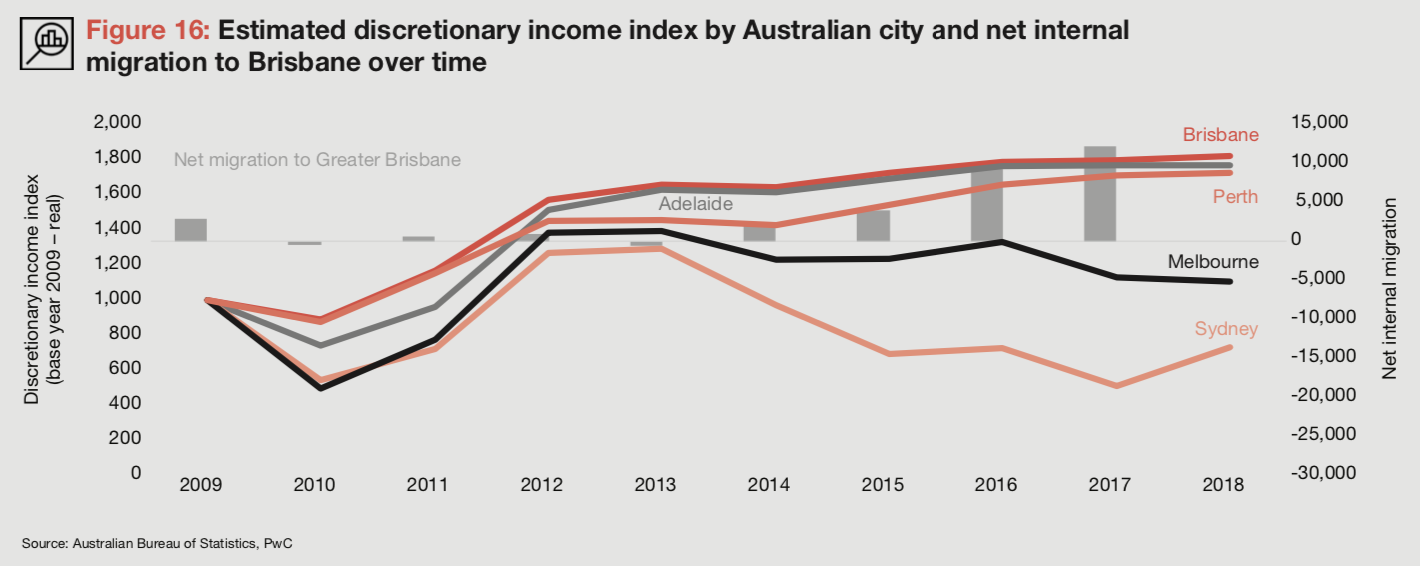
Mapping the level in discretionary income between 2008 and 2018 reveals a familiar inverse ‘U’ shape for Melbourne and Sydney (Figure 16). This reflects similar impacts to those in New Zealand’s Growth Cities. Interestingly though, Brisbane, Perth and Adelaide have avoided the declining discretionary incomes plaguing other cities. This positions them as the biggest movers over the last decade. While the impact of discretionary income on migration flows requires more sophisticated modelling, the strengthening of net internal migration in Brisbane is notable and coincides with relative increases in discretionary income.
The comparison with Australia suggests New Zealand faces strong competition. Figure 18 shows the change in discretionary income between 2008 and 2018 for all 11 cities (indicated by the grey dot). The bars decompose changes in discretionary income by income, basic expenditure and housing costs.
Brisbane and Adelaide have made significant gains in economic competitiveness over the last decade (increasing by $380 and $290 per week respectively) despite relatively weak income growth. The secret is remarkably low living costs. Perth, helped by a mining boom, experienced the largest gains in estimated discretionary income ($403 per week) by combining income growth and low housing costs.
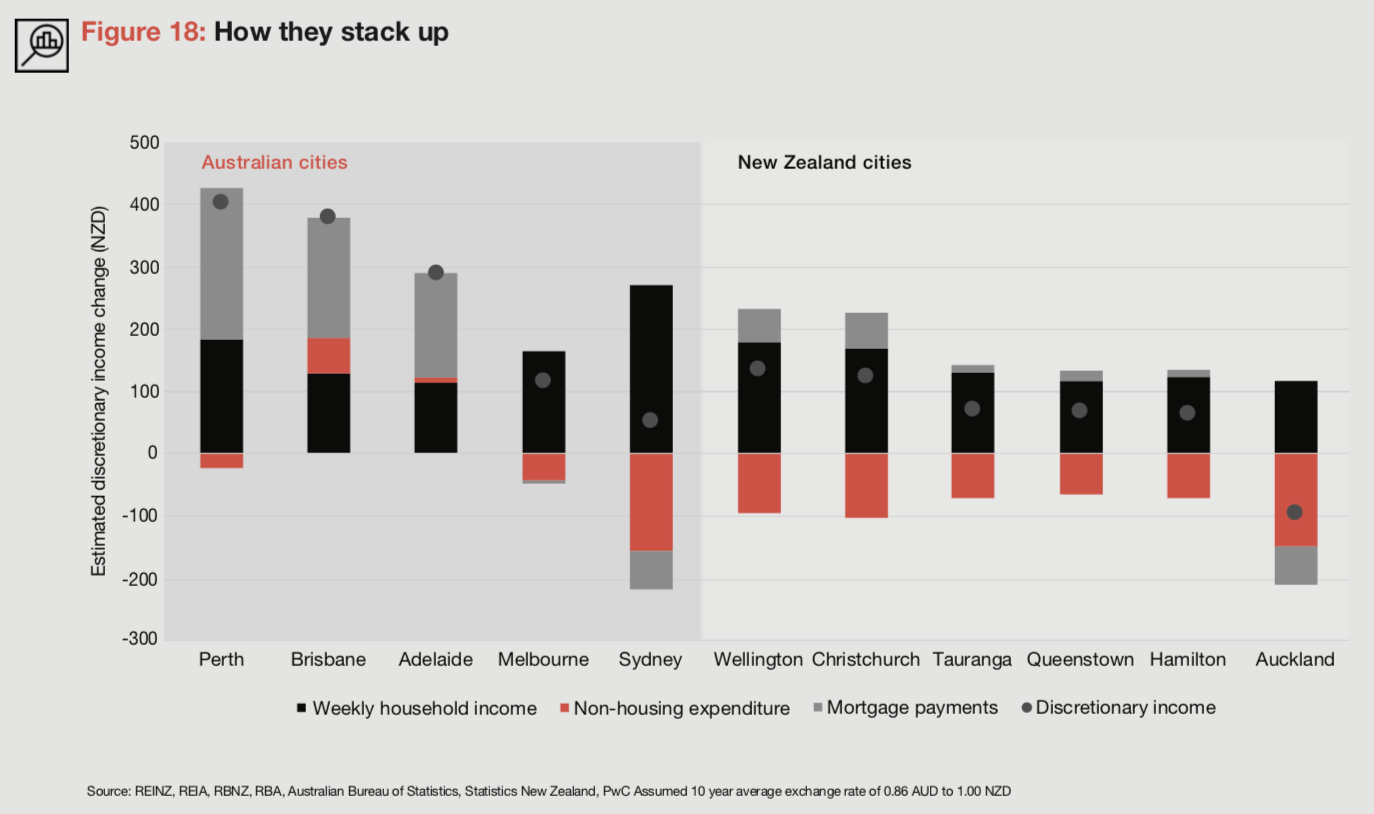
Wellington and Christchurch use a different recipe. Rising incomes and low house price growth offset rising basic expenditure in these two cities. New Zealand’s smaller Growth Cities followed a more moderate, but ultimately similar pattern.
The largest cities in their respective countries fared differently. Rising living costs in Sydney and Auckland were a significant drag. While Sydney was able to offset this with significant gains to income however, Auckland income growth was sluggish. As a consequence, Auckland was the only city to experience a real decline in discretionary income over the period (-$96 per week).
6. Future proofing our cities
Recommendations
The ability to attract talent in the face of evolving and integrated markets is crucial to a city’s success. On this count over the last decade, the competitiveness of cities in Australasia has undergone remarkable changes. Paying more attention to these changes is important, and to this end we make three recommendations:
Recommendation 1: Appointment of a Minister for Cities
New Zealand needs a champion for the competitiveness of New Zealand cities, taking a holistic view of our urban areas and acting as a centralised channel of communication with strategically important cities. To this end, New Zealand should follow the lead of Australia and create a Minister for Cities. The Minister for Cities would be responsible for developing and extending the evidence base of urbanisation in New Zealand, taking a comprehensive view of urban living costs (by considering transport, housing and environmental costs together for instance) and advising on urban growth and development as it pertains to emerging issues such as wellbeing and inequality, energy efficiency, carbon neutrality and national economic performance.
Recommendation 2: Urban Statistics Rollout
New Zealand needs better urban statistics to understand the dynamic nature of city competitiveness. While improvements have been made in recent times (such as annual regional GDP estimates and urban population categorisation), further improvement is needed. This could include the development of regular urban migration data (using the methodology recently established by Treasury), the centralisation and availability of urban land value data in a form that is useful for policymakers and researchers, the expansion of the Household Economic Survey to all cities, and quarterly availability of regional GDP estimates. There are also opportunities to establish a comprehensive set of real time data to help with urban decision making and implement tools to better utilise big data at the city level.
Recommendation 3: An Economic Competitiveness Agenda for Auckland
Auckland is New Zealand’s most internationally competitive city, but it faces significant challenges. Auckland needs an all-of-government Economic Competitiveness Agenda that positions it as a modern economic powerhouse of the South Pacific. This should address a variety of issues such as sustainability, infrastructure and quality of life, but also include concrete steps to lower the cost curve of urban living, generating momentum for wage growth and capital accumulation, and overcoming the labour shortage.
Our cities need a ruthless focus on data.
Bibliography and references
1. Martin, R. & Simmie, J. (2008). The theoretical bases of urban competitiveness: does proximity matter.
Retrieved from https://www.cairn.info/revue-d-economie-regionale-et-urbaine-2008-3-page-333.htm
2. Smith, A. & Porter, M. (1990). The Competitive Advantage of Nations. New York: The Free Press
3. Kresl, P. & Singh, B. (1990). Competitiveness and the Urban Economy: Twenty-four Large US Metropolitan Areas. Urban Studies, Vol. 36, Nos 5-6, 1017-1027.
4. United Nations. (2014). World Urbanization Prospects (pp. 1) Retrieved from https://esa.un.org/unpd/wup/publications/files/wup2014-highlights.pdf
5. Brookings: Global Metro Monitor 2018. (2018). Retrieved from https://www.brookings.edu/research/global-metro-monitor-2018/
6. Florida, R. (2002). The Rise of the Creative Class. New York.
7. Glaeser, E. (2011) Triumph of the City. New York, NY: The Penguin Press.
8. Thorns, D. &Schrader, B. City history and people – The appeal of city life, Te Ara – the Encyclopedia of New Zealand.
Retrieved from http://www.TeAra.govt.nz/en/graph/23512/population-of-the-four-main-cities-1858-2006
9. For a more thorough description, including drivers of urban success and decline, see Moretti, E. (2012) The New Geography of Jobs.
10. For more information on land market flexibility in New Zealand see New Zealand Treasury. (2012). Chew Session on Competitive Land Markets.
11. Lever, W.F. & Turok, I. (1999). Competitive Cities: Introduction to the Review. Urban Studies, Vol. 36, Nos 5-6, 791-793
12. We follow a similar methodology to Glaeser, E. (2008). Houston, New York has a Problem.
City Journal Magazine. Retrieved from https://www.city-journal.org/html/houston-new-york-has-problem-13102.html
13. Kelly, J. (2018) JLL: City Momentum Index 2018.
Retrieved from https://www.jll.ca/content/dam/jll-com/documents/pdf/research/global/JLL-City-Momentum-Index-2018.pdf
14. Kresl, P. & Singh, B. (1990). Competitiveness and the Urban Economy: Twenty-four Large US Metropolitan Areas. Urban Studies, Vol. 36, Nos 5-6, 1017-1027.
15. Where possible we use the urban footprint of a city as the spatial area of interest. In New Zealand we generally use territorial authorities as a proxy for each of the growth cities. Deviations, when necessary, are made clear. In Australia, we use the greater urban area.
16. As defined by Statistics New Zealand subnational rural urban classifications.
17. We use the central business district for Hamilton, Tauranga, Wellington, Christchurch and Queenstown. For Auckland, we also include Manukau in the South and Albany in the North.
18. While efforts were made to disaggregate expenditure changes at a more granular level, survey data is limited by a small sample size, meaning changes at other regional levels are not reliable.
19. Our assumption that the household has the required deposit means that we are unable to capture the effects of loan to value regulations that were implemented in 2013.
Because of the comparative nature of the study, this doesn’t affect comparisons between New Zealand cities (which are uniformly affected by the regulation) but it does affect comparisons with Australian cities which are subject to different regulations.
20. UNhabitat. (2013). The competitiveness of cities (pp. 4) Retrieved from https://unhabitat.org/
Glossary
Supporting Growth Areas: Towns or developments that lie outside the contiguous urban areas, but within 40 minutes of an employment hub in a Growth City.
Growth City: Areas with a relatively small population base and very high annual growth rates (e.g. Queenstown) as well as areas with lower annual growth rates but a larger population base (e.g. Wellington). The six Growth Cities are Auckland, Hamilton, Tauranga, Wellington, Christchurch and
Queenstown.
Household income: All household earnings from a usually resident aged 15 years and over. It includes all sources of income, such as wages, self-employment, rent, dividends, interest and government payments.
Mortgage payments: Calculated using a three year mortgage rate (calculated for each year of the analysis) and principal equal to 80 per cent of the house price, using a 30 year repayment period.
Basic expenditure: Consists of four categories: food, transport, education and health.
Discretionary income: What remains from income after deducting tax, mortgage payments and basic expenditure.
Active trips: Trips designated as either walking, cycling or public transport.
Median: A number which lies at the midpoint of a distribution, such that there is equal probability of falling above or below it.
Source: pvc
P.S. I research and interview economists, tax consultants and property mentors to find tools & tactics that you can use to save money and time.
➔ Join my private newsletter to be the first one to learn insider tips!
